Map rule dependencies
Goal
See one rule evaluation as a graph: the fields you changed, the rules that fired, and the fields, sections and feedback items those rules affected. Use it to follow a chain of rules, for example an assignment that makes another rule fire.
Before you start
- You have a program open in the playground. See Find and open a program.
- You have changed at least one value in the form. The graph only shows rules that fired.
Steps
- In the rules panel next to the form, select the Graph tab. It shows the latest evaluation.
- To look at an earlier evaluation, select an entry in the Trace tab, then go back to Graph. To highlight one rule, select its card on the Rules tab or its name in a Trace entry. Both open the Graph tab. See Find out why a rule did or didn't fire.
- Read the graph from left to right: field, then rule, then target.
- Hover an edge to see its label if it isn't shown.
- Use the zoom controls to zoom in and out. You can drag nodes to tidy the layout.
- To see a large graph better, select the Open graph in full screen button (the full-screen icon) in the graph toolbar. The graph opens in a dialog titled Rule dependency graph. If you highlighted an evaluation or a rule, the dialog shows it under the title. Close the dialog to go back to the panel.
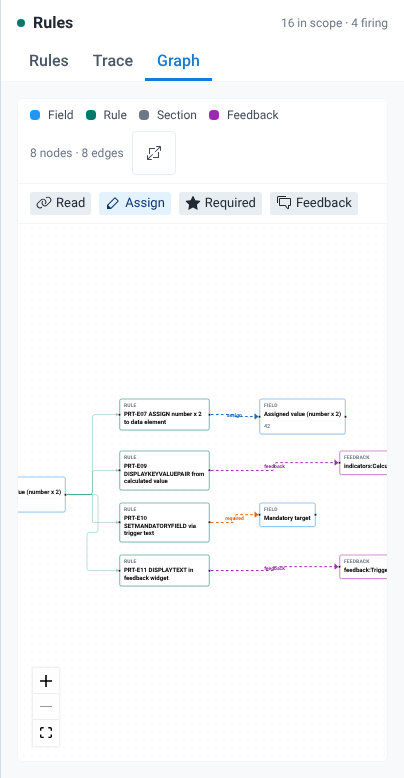
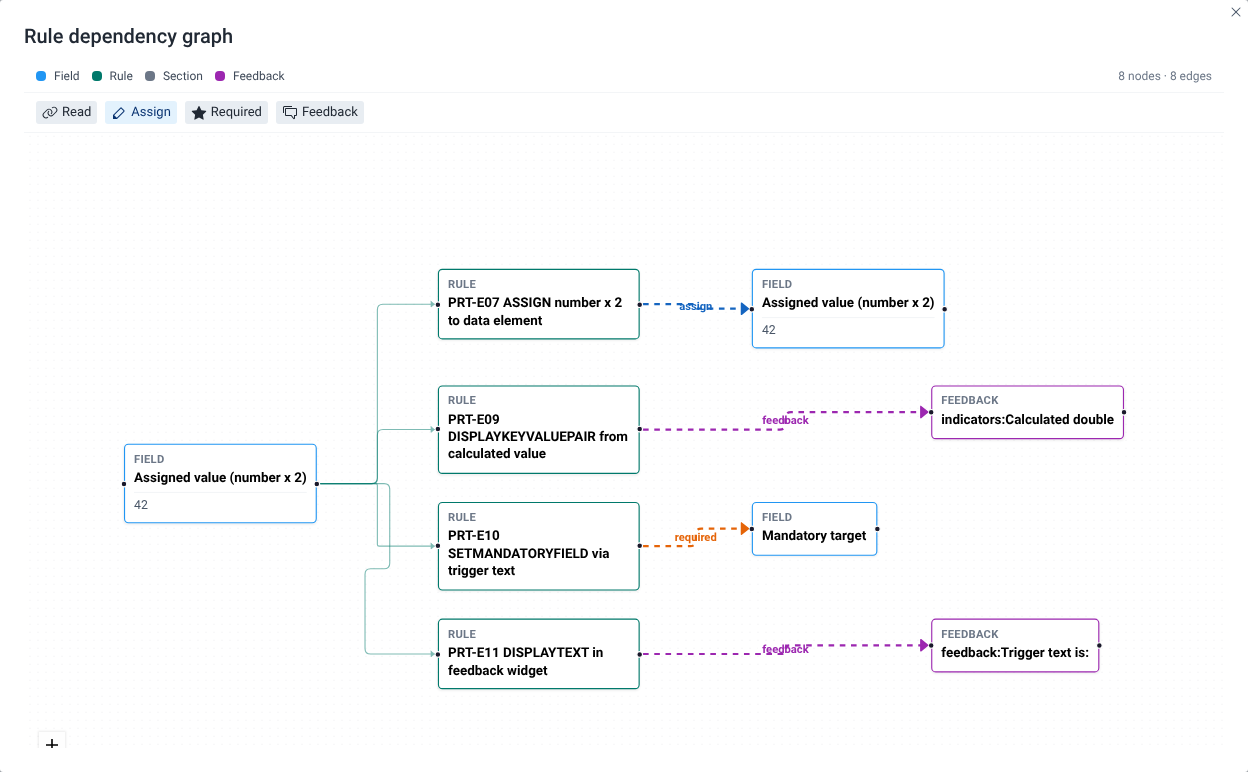
What you'll see
Nodes
The toolbar shows a colour swatch for each kind of node, and the number of nodes and edges, for example "6 nodes · 5 edges".
| Node | What it is |
|---|---|
| Field | A data element or attribute. It is either a field you changed in this evaluation or a field a rule acted on. A field node shows the field's current value, when it has one. |
| Rule | A program rule that fired in this evaluation. |
| Section | A section that a rule hid. |
| Feedback | A Feedback or Indicators item that a rule displayed. The node is labelled with the location and the item's static text, for example "indicators:Calculated double" or "feedback:Trigger text is:". |
Edges
- An edge from a field to a rule is a read edge. It links the fields that changed in this evaluation to each rule that fired. If you changed a field and no rule fired, the graph shows only that field.
- An edge from a rule to a target is an effect edge. Its label and colour show the kind of effect, for example hide, assign or warning.
The read edge links every changed field to every rule that fired, whether or not the rule's condition uses that field. The changed fields include fields that a rule assigned. When an ASSIGN action changes a value, the form evaluates its rules again, and the graph of that evaluation shows the assigned field, for example Assigned value (number x 2), as the only source field, linked to every rule that fired. To see which fields a rule actually reads, open its details and look at Variables referenced. See Open and edit a rule.
When the graph has more than four edges, the read edge labels are hidden. Hover an edge to show its label.
The toolbar also has a legend that lists the effect kinds that appear on the edges in the current graph, for example Read, Hide, Assign or Required. For the colours and icons, see the Effect badges legend.
The empty graph
When the evaluation has nothing to show, for example right after the form loads with no rule firing, the Graph tab shows:
No rule relationships yet
Interact with the form to build the dependency graph. Only rules active in the latest evaluation are shown. Select a trace entry to inspect a past evaluation. Connections flow Field → Rule → Target (read / effect).
The full-screen button only appears when the graph has nodes.